The Results overview screen is the hub for most Quality Control and QESH Management functionalities and likely your first stop in AlisQI. It's a feature-rich screen that provides real-time data for every analysis set and selection list. It's also the starting point for many data actions, from setting specifications to performing statistical analyses.
This article shows you how to open a results overview screen, create filters, and manage results data. We also show you how to generate reports and access other data management features.
In this article
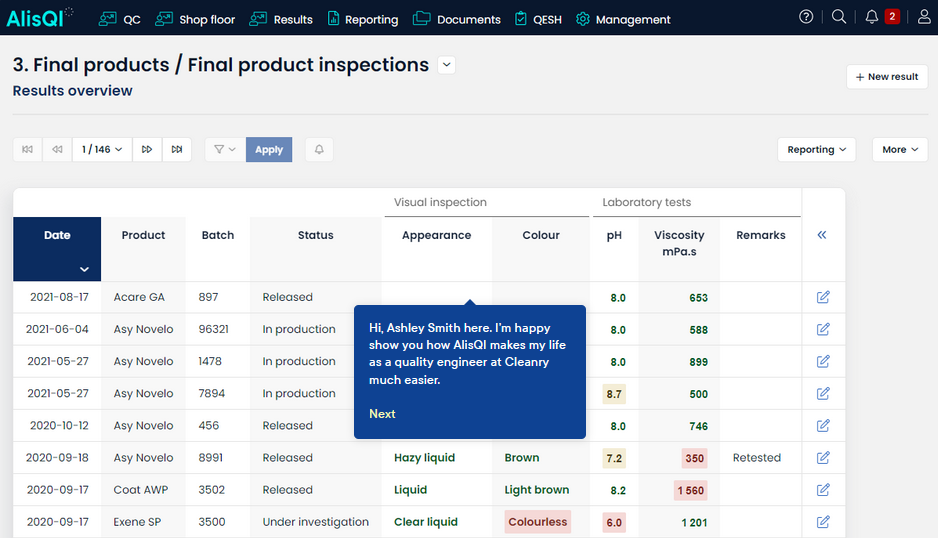
Interactive tour
Probably the quickest way to familiarize yourself with the Results overview is by means of the interactive tour. Click here or on the visual below and try for yourself.
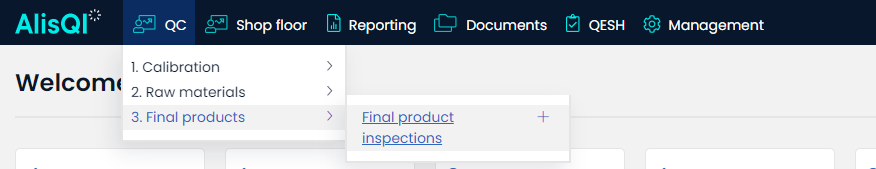
Opening an overview
Open any results overview from the AlisQI navigation menu bar. You can define the structure of the top level menu yourself.
Number of results per page
You can change the number of results per page in the application settings.
Sorting and filtering
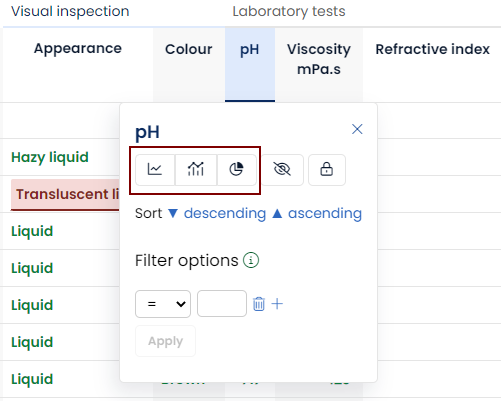
Sorting
To sort overview data, click a column header (1) and then select the desired sort direction (2). In the example below, we look at pH values in descending order.
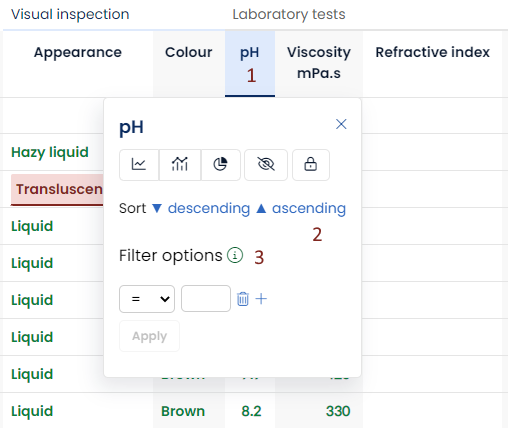
Filtering
To narrow the results on display:
- Click a column header to open the filter window.
- Set a filter.
- Click Apply in the filter window.
- Repeat steps 1-3 to filter other column data.
- Click the Apply button in the toolbar.
Steps 4 and 5 allow you to set filter conditions for multiple columns. While they are optional, adding extra filters enables you to save time and makes your results overview very specific.
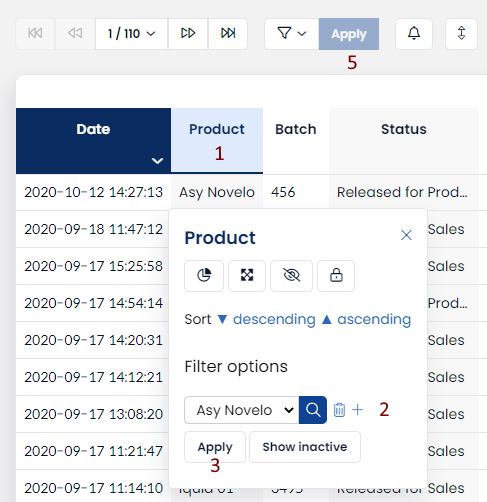
The rationale for the two "Apply " buttons is that you can set filter conditions for multiple columns.
Advanced filter syntax
Read all about the more advanced filter capabilities here.
Save a filter
You can save a filter and use it later.
- Create a filter (as described above).
- Open the filter panel
- Enter a filter name and click Save.

Any user with read permissions can save a filter, or use a saved filter.
Result actions
Each row in a Results overview has a toolbar on the right side of the screen.
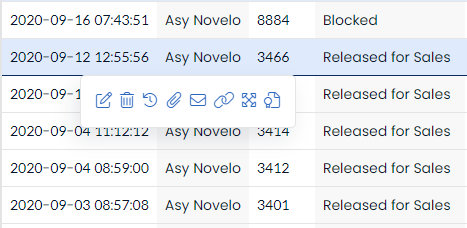
From left to right these symbols represent the following:
- Edit
Modify a result. - Delete
Delete a result. - History
Show a result's change history (audit trail). - Show attachments
Show a result's attachments. - Write message
Send a message to another user with a link to a result. - Show traceability links
Show a single overview with this and all linked results. - Open full results overview
View results in full screen - Create a new Certificate of Analysis
Generates a Certificate of Analysis
Depending on the user permissions, the number of features in the toolbar can vary.
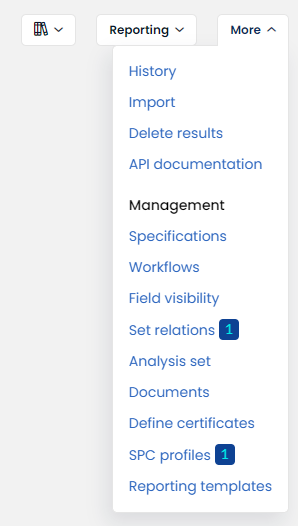
Reporting and Management
The Results overview is your entry point for many functionalities.
Reporting
Click the Reporting button to display a list of reporting tools, including Excel download, statistics, reports, and charts.
You can also access charts by clicking a column heading. The range of chart options varies with the type of column data.
Management
Click the More button to open a menu of links to specifications management, the analysis set, and workflows. You can change the number of results per page in the application settings.